Tampilkan postingan dengan label accurate. Tampilkan semua postingan

Minggu, 08 Mei 2016

ACCURATE EXIT STRATEGIES PROVIDE GAINS AHEAD OF SHARP REVERSALS - martingale forex trading system

ACCURATE EXIT STRATEGIES PROVIDE GAINS AHEAD OF SHARP REVERSALS ~ martingale forex trading system


Last month, the EURO JPY and CHF JPY pairs broke their respective Consolidation Setups on their Daily Charts to start downtrends in favour of the Japanese Yen. This was expected to provide several hundreds of Pips in gains for traders over several weeks given the size of the Consolidations that were broken. However, although the CHF JPY did move by over 200 Pips (providing us with a 101-Pip gain), the EURO JPY only provided us with just under 50 Pips in profits before pulling back. 

Nevertheless, despite the combined profitability of these trades being lower than expected, the sharp 400-Pip reversals that took place highlighted the accuracy of the Holding Periods used for these Swing Trading Strategies.


EURO JPY TRADE


A target of 172 Pips was initially set to be captured from the Pennant breakout below its Support boundary. However, due partly to the lack of market activity during the Thanksgiving holiday period, the trade was only up by 47 Pips at the end of the Holding Period - smaller than expected but a win nevertheless.


DAILY CHART
(FXCM Charts used for Entry Signals as they use the New York Close of the Daily Candle - crucial for the Price Action Methodology)


DAILY CHART
(Actual Trades done using the Dukascopy Platform)


The decision to exit this trade was controlled by the Holding Period Rule for this breakout strategy. As you can see from the Trade Sheet, a maximum of 7 Days is used for these trades and once this limit has been reached, the trade is closed - regardless of the floating profit or what we would have wanted from the trade.


TRADE SHEET
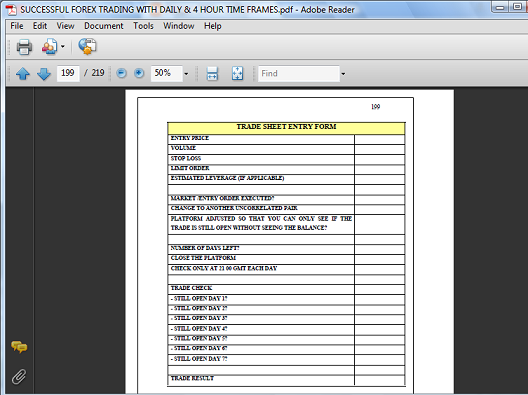
(Trading Manual - "Successful Forex Trading With the Daily and 4 Hour Time Frames".
Available at www.drfxswingtrading.com)


CHF JPY TRADE


This was a similar trade that took place during the same period as the EURO JPY breakout. A Pennant Setup was also being broken at Support following a pullback that tested then U-Turned at this boundary. The nature of the candles that started the breakout indicated that we would be using the Swing Trading Strategy for Slow Breakouts.


DAILY CHART


Having determined that the setup and signals conformed to the criteria for this strategy, the trade was executed with an initial target of 180 Pips. However, at the end of the Holding Period for this strategy, the trade was up by 101 Pips - again, smaller than planned but a good trading gain nevertheless.


DAILY CHART


SHARP REVERSALS

The decisions to close these trades at the end of their respective Holding Periods were proven to be spot on given the reversals that took place a few days later. These reversals reflected the market reaction to the decisions made by the European Central Bank on Thursday December 4, 2015.


EURO JPY


CHF JPY


The reversals on both now indicate that we are starting the patterns of False Breakouts that will take us quickly back inside of these Consolidations. Following this, it is likely that they will breakout at Resistance to start strong Uptrends in favour of the EURO and the CHF. 

These sharp movements reinforced the need for Swing Traders to always implement and obey the time limits set for our trades. Reversals of 10, 20 or even 40 Pips are usually the consequences of disobeying these rules, but pullbacks of 400 Pips have a way of sobering us up to the harsh reality of what this market can do to us when we trade based on emotions, greed and our ego. It is often very tempting to want more out of a trade especially after a loss or when the market has only given us a fraction of what we want out of a trade. However, it always better to have smaller gains than large losses. 


More info for ACCURATE EXIT STRATEGIES PROVIDE GAINS AHEAD OF SHARP REVERSALS ~ martingale forex trading system:

Kamis, 05 Mei 2016

The Hallmark of Accurate Technical Analysis Money - order flow forex trading system

The Hallmark of Accurate Technical Analysis Money ~ order flow forex trading system


The hallmark of accurate Technical Analysis is the ability to spot market movements several days and weeks ahead of other Traders for larger trading gains. This puts you at a significant advantage when it comes to trading these expected moves, while confirming the superiority of your Methodology. A few examples of Chart Forecasts using only Candlestick Patterns and Signals shows how this accuracy can be achieved to provide real results, without the use of Statistical Indicators or Economic Analysis.

On July 1 this year, there was a Bullish Consolidation Breakout on the AUD USD that appeared to indicate the continuation of the strong uptrend in place. This would possibly have taken us to the 0,9757 Resistance of October 2013 and provide strong Day Trading and Swing Trading gains. 


DAILY CHART -  BREAKOUT


DAILY CHART - EXPECTED TARGET


However, this would gave way to a strong Bearish Reversal Candle that took out our Stop Loss when we entered to go long.


DAILY CHART - FALSE BREAKOUT


With this sudden change, one had to now re-examine the Currency Pair to determine if it would attempt to rally once more or start a Bearish trend in favour of the US Dollar. Based on the range and the nature of the candles of the previous trends since July of 2013 (Section 5 - Consolidation Trading on the Forex Market) and this most recent False Breakout, the pair was now more likely to decline within the context of a large Pennant Consolidation.


DAILY CHART - CONSOLIDATION FORECAST


This expected decline to Support eventually began on September 9th when a Bearish Candle broke the Support of a Consolidation setup. This would lead to a sharp 600-Pip decline over 3 weeks, completing the formation of the Pennant with the 2nd Resistance point.


DAILY CHART - CONSOLIDATION BREAKOUT


DAILY CHART - LARGE PENNANT FORMED


Since this setup was in sync with the Methodology, my clients were able to take advantage with a 148-Pip trade between the 11th and 17th of September.


TRADE SETUP


DAILY CHART - AUD USD TRADE RESULT
Live Trades executed on Dukascopy Platform


The AUD NZD was another pair that offered a profitable trade in line with our strategy. It also formed another Consolidation pattern a few weeks later that was in line with my analysis.

On August 25, 2014, there was a brief Bullish breakout from a Consolidation pattern on the Daily Chart that allowed my clients to capture 69 Pips, just ahead of the reversal a few days later.


DAILY CHART- AUD NZD PENNANT 


DAILY CHART - AUD NZD 69-PIP TRADE


Given the large size of the Pennant that was being broken, most analysts would have expected the move to last for several weeks and provide hundreds of Pips in trading gains. Fortunately, based on the parameters of my Methodology, my clients would not have been caught by this reversal. Our targets are always set to anticipate these pullbacks in the market regardless of the long-term forecasts.

These targets are at major price points in the market that either lead to temporary pullbacks before the breakout continues or reversals in trend direction. Since one can never be certain about what will take place at these areas, we always exit there for large, assured, short-term gains (Section 6 - Consolidation Trading on the Forex Market).

As this reversal continued, the nature of the candles suggested that the pair would not go back inside of the Pennant but would form a smaller Consolidation above the Resistance (Section 5 - Consolidation Trading on the Forex Market).


DAILY CHART - AUD NZD FORECAST 
Trade executed on a Demo Account, but too Risky for a Live Account 


As can be seen in the chart below, our expected formation has now materialized. A Pennant has now been formed that could give way to another Bullish breakout for sharp Aussie gains.


DAILY CHART - AUD NZD PENNANT FORMED


Finally, the CHF JPY whose pattern of Consolidation reflected the ongoing story of low liquidity and market volatilty, was also projected to decline. This followed yet another False Bullish Breakout attempt above its Resistance boundary. 


DAILY CHART- CHF JPY PENNANT BREAKOUT


DAILY CHART - CHF JPY ENTRY SIGNAL


This reversal was expected to lead to a decline to the Support area at 111.91. Trading this movement was possible and my clients were able to capture 76 Pips of this decline after a small initial loss.


TRADE SETUP - CHF JPY


DAILY CHART - CHF JPY RESULT


SUMMARY

The accurate analysis of these major chart patterns can be done without Statistical Indicators or Economic Data that are usually late to the party. This market has a predictable cycle of patterns and signals that are seen across the Forex Market every day and for all Currency Pairs. Once they are identified and analyzed with the right set of Technical Parameters, your forecasts are more likely to match up with actual market movements- movements that can be traded for large and consistent profitability.


___________________________________________________________


RECENT EMAIL FROM CLIENT


____________________________

GET STARTED TODAY
____________________________


Buy Now
US$99.00


Support independent publishing: Buy this e-book on Lulu.
US$99.00


Buy Now
US$69.99


Buy Now
US$49.99


Support independent publishing: Buy this e-book on Lulu.
FREE


Support independent publishing: Buy this e-book on Lulu.
FREE

(See "SWING TRADING STRATEGY & TRADE RESULTS" for Product Details)
_____________________________


Duane Shepherd 
(M.Sc. Economics, B.Sc. Management and Economics)
Currency Analyst/Trader
Contact: shepherdduane@gmail.com
Twitter: @WorldWide876
Facebook: DRFXTRADING 


More info for The Hallmark of Accurate Technical Analysis Money ~ order flow forex trading system:

Jumat, 22 April 2016

FORECASTING TOOLS THAT ALL FOREX TRADERS NEED - forex envelope profit system trading made easy

FORECASTING TOOLS THAT ALL FOREX TRADERS NEED ~ forex envelope profit system trading made easy


The Candlestick Signal and Patterns in the Trading Manual are extremely powerful in forecasting and taking advantage of the Currency Market each week. However, even if you are a Swing Trader or Day Trader with your own trading strategy, the power of these tools to accurately predict major market movements will definitely enhance your trading success.

The Daily and the 4 Hour Charts are undoubtedly two of the most significant time frames in the Forex Market. This therefore means that breakouts and reversals that take place on these charts have a major impact on the other time frames you trade on and your profitability in general. By ignoring them as Day Traders, you could be caught by surprise with reversals that appear out of nowhere while as Swing Traders, you could miss additional signals that provide even more trading opportunities.


There are various patterns of Candlesticks that have been identified to predict the formation of Consolidations as well as when reversals of several hundred Pips will take place. Once you incorporate these into your Trading Plan, you can be better prepared to exit at the right moment before the market has a chance to take away your gains.


FORMATION OF CONSOLIDATION
_________________________________


 CONSOLIDATION FORECAST - CAD CHF 
SEPTEMBER 2, 2015
(FXCM Charts are used for Chart Analysis &Signals as these use the New York Close of the Daily Candle - crucial for Price Action/Candlestick Strategies)


ACTUAL FORMATION OF CONSOLIDATION 
DECEMBER 10, 2015
(FXCM Charts are used for Chart Analysis &Signals as these use the New York Close of the Daily Candle - crucial for Price Action/Candlestick Strategies)


ACCURATE EXITS AHEAD OF SHARP REVERSALS
_________________________________


SHARP CHF GAINS IN JANUARY 2015
(Actual Trades done using the Dukascopy Trading Platform)


 CHF JPY TRADE IN NOVEMBER 2015


SHARP REVERSAL CHF JPY IN DECEMBER 


EURO JPY TRADE IN NOVEMBER 2015


SHARP EURO JPY REVERSAL IN DECEMBER


As you can appreciate from these examples, the ability to forecast Consolidation and spot reversal points will help you to maximize trading gains and side-step the traps that lead to major losses. This is why it is extremely important for all types of traders to utilize and understand the dynamic behind the Larger Time Frames. It is very easy for us to get caught up in getting as much out of a trade as possible especially after a recent loss. However, knowing when it is necessary to cut our profits before they turn into losses will be the determining factor in your long-term success.


More info for FORECASTING TOOLS THAT ALL FOREX TRADERS NEED ~ forex envelope profit system trading made easy:
 

Income from Forex Robot Copyright © 2016 -- Powered by Blogger