Tampilkan postingan dengan label sharp. Tampilkan semua postingan

Sabtu, 21 Mei 2016

RATE OF RETURN NOW 13 0 ON SMALL AUD CAD TRADE - forex odyssey trading system

RATE OF RETURN NOW 13 0 ON SMALL AUD CAD TRADE ~ forex odyssey trading system


This trade was intended to take advantage of a sharp breakout short from a Pennant Consolidation, with the target set for its Breakout Equivalent. All Consolidations have Breakout Equivalents (B.E.) - it is the area that they break towards before pulling back. They will either pause here to then resume the trend or become volatile and reverse. Nevertheless, once spotted and measured accurately, one should either be exiting your trades there (see the AUD USD 148 Pip Trade and the AUD NZD 70 Pip Trade) or avoiding entries at these areas altogether.

In this instance, the pair had already broken out from a previous Range and was now breaking a Pennant. 


DAILY CHART - AUD CAD
(FXCM Charts used for Trade Signals- Dukascopy used for Live Trades)


Based on the way I had originally measured the B.E. for this Range, it would not be hit until a few hundred pips. However after analyzing the chart again for confirmation that my Entry Setup was correct, I realized the error and exited immediately. This provided only a small gain of 9,6 Pips, but was much better than what would have taken place if it was left any longer.


This was the entry setup on the 4 Hour Chart. It required waiting on the market to pullback so that my Stop Loss would have met the criterion in the strategy.


4 HOUR CHART - TRADE SETUP


Entry then took place as the market pulled back to trigger the entry but shortly after, I realized that this B.E. was actually at the Entry Price of my trade.


DAILY CHART


Luckily I was able to come out before the rally took place, which would have taken out the Stop Loss.


DAILY CHART- PULLBACK


Following this trade which pushed the rate of return to 13.0%, my Subscribers are still 9 trades away from a 100% return.


RATE OF RETURN FROM METHODOLOGY


The FXCM Demo Account that you will see in MyFxbook does not reflect this trade. The entry order was not triggered due to the natural differences in prices that takes place across trading platforms.


Mistakes like these are par for the course. Sometimes they lead to large losses, but sometimes you get lucky with only a small loss or gain. It can be very difficult to exit a trade that has the potential for large gains. However, this is perhaps the best trading decision that one will make when large sums of your funds or those of your clients are at stake.


___________________________________________________________


RECENT EMAIL FROM CLIENT


________________________________________


________________________________________

Duane Shepherd
(M.Sc. Economics, B.Sc. Management and Economics)
Currency Analyst/Trader
Contact: shepherdduane@gmail.com
Twitter: @WorldWide876
Facebook: DRFXTRADING
Website: www.drfxswingtrading.com

More info for RATE OF RETURN NOW 13 0 ON SMALL AUD CAD TRADE ~ forex odyssey trading system:

Kamis, 19 Mei 2016

GBP AUD MAJOR DOWNTREND REVERSAL IN SIGHT - stealth forex trading system review

GBP AUD MAJOR DOWNTREND REVERSAL IN SIGHT ~ stealth forex trading system review


OVERALL SCENARIO


  • At End of a Major Uptrend;
  • Broken Inner & Outer Trend Lines;
  • Within a Large Pennant Consolidation;
  • Possible Rally to Resistance;
  • Likely Break of Support to Start Downtrend
  

CHART 1 - END OF MAJOR UPTREND


POSSIBLE SHORT-TERM SCENARIOS

  • Rally to Pennant Resistance after/without hitting Support;
  • Break of Pennant Support to Start New Downtrend;


CHART 2- PENNANT CONSOLIDATION


 LONG-TERM SCENARIO


  • Support Likely to be Broken;
  • Major Uptrend has ended, Trend Lines Broken,Large Pennant Formed;
  • This is the typical setup for a new, major Trend Change;


ACTION RECOMMENDED

  • Wait for Strong Bull Signal now or at Support to Trade to Resistance;
  • Wait for Strong Bearish Break to start Downtrend;
  • Aim for 100 - 200 Pips;


RECENT EMAIL FROM CLIENT


____________________________________________________


SUBSCRIBE TODAY

____________________________________________________


Buy Now
US$120.00


Support independent publishing: Buy this e-book on Lulu.

Free 
 ___________________________________________


Duane Shepherd 
(M.Sc. Economics, B.Sc. Management and Economics)
Currency Analyst/Trader
Contact: shepherdduane@gmail.com
Twitter: @WorldWide876
Facebook: DRFXTRADING 

More info for GBP AUD MAJOR DOWNTREND REVERSAL IN SIGHT ~ stealth forex trading system review:

Senin, 09 Mei 2016

GBP CAD 500 PIP RALLY IN NEXT FEW DAYS - neural spray forex trading system

GBP CAD 500 PIP RALLY IN NEXT FEW DAYS ~ neural spray forex trading system


This pair has started to break out above the latest Pennant setup on the Daily Chart which could set the stage for strong Pip gains in the days ahead. Before this takes place, however, we would need to see a stronger Bull Candle (Normal Candle) than the one that has appeared at the end of Mondays session. 


DAILY CHART - WEAK CANDLE BREAKOUT


Once we have this signal, we will be able to enter with greater confidence that another 200-Pip trade will be there for the taking.


The expected rally would continue the momentum of the major break out above the Outer Downtrend Line, which started a few weeks ago on January 21, 2015.


DAILY CHART- OVERALL DOWNTREND


DAILY CHART- START OF TREND LINE BREAK


As is typical of the Currency Market, breaks of major barriers such as these tends to take place with a break of a large Consolidation - a Pennant in this scenario. What this means is that any breakout from the smaller Pennant Setup would be supported by the momentum of the breakout from that larger Pennant- leading to profit targets being hit in a very short time.

If we see the hoped for Bull Candle this week, it will need to first go through our gauntlet of checks and balances prior to entry.


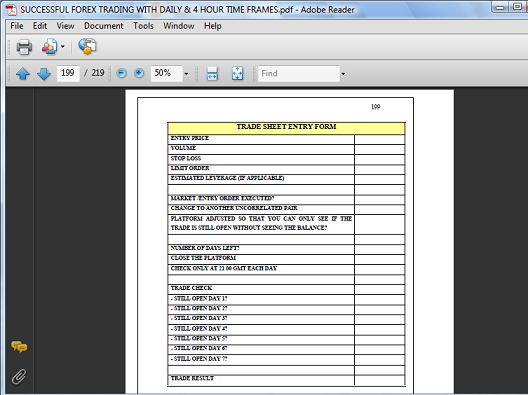
TRADE SHEET CHECKLIST


Once these criteria are met, another strong trading gain will be added to our growing trading accounts.


________________________________________


________________________________________

Duane Shepherd
(M.Sc. Economics, B.Sc. Management and Economics)
Currency Analyst/Trader
Contact: shepherdduane@gmail.com
Twitter: @WorldWide876
Facebook: DRFXTRADING
Website: www.drfxswingtrading.com


More info for GBP CAD 500 PIP RALLY IN NEXT FEW DAYS ~ neural spray forex trading system:

Minggu, 08 Mei 2016

ACCURATE EXIT STRATEGIES PROVIDE GAINS AHEAD OF SHARP REVERSALS - martingale forex trading system

ACCURATE EXIT STRATEGIES PROVIDE GAINS AHEAD OF SHARP REVERSALS ~ martingale forex trading system


Last month, the EURO JPY and CHF JPY pairs broke their respective Consolidation Setups on their Daily Charts to start downtrends in favour of the Japanese Yen. This was expected to provide several hundreds of Pips in gains for traders over several weeks given the size of the Consolidations that were broken. However, although the CHF JPY did move by over 200 Pips (providing us with a 101-Pip gain), the EURO JPY only provided us with just under 50 Pips in profits before pulling back. 

Nevertheless, despite the combined profitability of these trades being lower than expected, the sharp 400-Pip reversals that took place highlighted the accuracy of the Holding Periods used for these Swing Trading Strategies.


EURO JPY TRADE


A target of 172 Pips was initially set to be captured from the Pennant breakout below its Support boundary. However, due partly to the lack of market activity during the Thanksgiving holiday period, the trade was only up by 47 Pips at the end of the Holding Period - smaller than expected but a win nevertheless.


DAILY CHART
(FXCM Charts used for Entry Signals as they use the New York Close of the Daily Candle - crucial for the Price Action Methodology)


DAILY CHART
(Actual Trades done using the Dukascopy Platform)


The decision to exit this trade was controlled by the Holding Period Rule for this breakout strategy. As you can see from the Trade Sheet, a maximum of 7 Days is used for these trades and once this limit has been reached, the trade is closed - regardless of the floating profit or what we would have wanted from the trade.


TRADE SHEET
(Trading Manual - "Successful Forex Trading With the Daily and 4 Hour Time Frames".
Available at www.drfxswingtrading.com)


CHF JPY TRADE


This was a similar trade that took place during the same period as the EURO JPY breakout. A Pennant Setup was also being broken at Support following a pullback that tested then U-Turned at this boundary. The nature of the candles that started the breakout indicated that we would be using the Swing Trading Strategy for Slow Breakouts.


DAILY CHART


Having determined that the setup and signals conformed to the criteria for this strategy, the trade was executed with an initial target of 180 Pips. However, at the end of the Holding Period for this strategy, the trade was up by 101 Pips - again, smaller than planned but a good trading gain nevertheless.


DAILY CHART


SHARP REVERSALS

The decisions to close these trades at the end of their respective Holding Periods were proven to be spot on given the reversals that took place a few days later. These reversals reflected the market reaction to the decisions made by the European Central Bank on Thursday December 4, 2015.


EURO JPY


CHF JPY


The reversals on both now indicate that we are starting the patterns of False Breakouts that will take us quickly back inside of these Consolidations. Following this, it is likely that they will breakout at Resistance to start strong Uptrends in favour of the EURO and the CHF. 

These sharp movements reinforced the need for Swing Traders to always implement and obey the time limits set for our trades. Reversals of 10, 20 or even 40 Pips are usually the consequences of disobeying these rules, but pullbacks of 400 Pips have a way of sobering us up to the harsh reality of what this market can do to us when we trade based on emotions, greed and our ego. It is often very tempting to want more out of a trade especially after a loss or when the market has only given us a fraction of what we want out of a trade. However, it always better to have smaller gains than large losses. 


More info for ACCURATE EXIT STRATEGIES PROVIDE GAINS AHEAD OF SHARP REVERSALS ~ martingale forex trading system:

199 PIPS ON GBP CAD TRADE PUSHES RETURN UP TO 22 - best forex news trading system

199 PIPS ON GBP CAD TRADE PUSHES RETURN UP TO 22 ~ best forex news trading system


The Swing Trading Methodology continues to produce results with the most recent gain of 199 Pips on the GBP CAD. This brings the overall return from the strategy to 22% since it was launched in July, from only 8 trades. As it stands, clients are now only 8 trades away from a return of 100%, which is likely to be reached in the first four months of 2015. The Demo Account, which lags the Live Account by just 3 trades, is now up 17% since it was opened in October.

The Range Consolidation on the Daily Chart of this pair was initially broken short a few days ago, indicating the potential start of a sharp bearish breakout. However, given that the pair had already provided 3-Waves of Bearish Signals in breaking the Support boundary, a bullish pullback was always expected.


DAILY CHART


This reversal began a few days later with the appearance of Bullish Signals and a break of the Downtrend Line.


DAILY CHART


At this juncture, there were two possible scenarios that could have unfolded. The first was for the pair to continue its reversal and break back inside the Range, rallying sharply to the Resistance boundary once more.


DAILY CHART


This sharp rally would be typical of what takes place with False Breakouts. Not only would the reversal take the pair quickly to the other end of the Consolidation, they often lead to breakouts at the other end of the setup for even stronger gains for traders. Despite the bullish signals that initially favoured such a move, we also had to consider the bearish scenario as well.

The boundaries of Consolidations are often "tested" for a brief period before resuming the breakout. This "test" often takes the form of a U-Turn or a break of a small Consolidation setup formed at that area. A sharp bearish breakout following such a pullback was also a scenario to be considered.


DAILY CHART 


As it turned out, the bullish scenario eventually took precedence as the pair provided an ABC Reversal Signal to continue the False Breakout Reversal. The pair of Double Bottoms below the Range also provided support for the trade. 


DAILY CHART
FXCM Charts are used to provide signals based on the New York Candle Close of the Daily Chart


Given this strong setup and signal, entry then took place on the 4 Hour Chart. The Stop Loss was placed below the Range and the Entry Order set just above its Resistance in expectation of a pullback. This would allow our Stop Loss to comply with the 120-Pip maximum for entries based on the Daily Chart. 


4 HOUR CHART


This was the Entry Trade Sheet as sent to my Subscribers;


TRADE SUMMARY & SETUP 


PAIR
GBP CAD
TRADE TYPE
FALSE CONSOLIDATION BREAKOUT
ENTRY DATE
TODAY, DECEMBER 8, 2014
TRADE DIRECTION
LONG/BUY
ENTRY TYPE
ENTRY ORDER
ENTRY PRICE (MAXIMUM)
1,7904
STOP LOSS
1,7784
LIMIT ORDER
1,8104


MAXIMUM HOLDING PERIOD
7 DAYS - WEDNESDAY DEC. 17, 2014
DAILY TIME CHECK
21 00 GMT


After pulling back to test the Resistance of the Range our Entry Order was triggered. Following the U-Turn to resume the breakout, the target was hit a few days later.


4 HOUR CHART


DAILY CHART- LIVE ACCOUNT RESULT


This movement to our target was very fast. Given that we had the combination of the Double Bottoms, a False Breakout Setup and the ABC Signal - which individually always lead to sharp movements - the short duration of the trade was not a surprise. 

The main Technical factors involved in this trade were;


  • The 3-Wave Rule (Section 4 - Consolidation Trading on the Forex Market);
  • Double Bottoms (Section 3 - Currency Trading with the Daily & 4 Hour Charts);
  • False Consolidation Breakouts (Section 6 - Consolidation Trading on the Forex Market);
  • ABC Signals (Section 6 - Consolidation Trading on the Forex Market);


Placing this trade in a larger context, the Methodology has now produced a 22% Rate of Return since it started in July of this year. Only 8 trades have been made so far with a simplistic assumption that will be no further losses, clients are only a handful of trades away from realizing a 100% return.


RATE OF RETURN AS AT DECEMBER 12, 2014


These projections assume that each of the next trades will provide a 150 Pip value, which is the average of our 100 to 200 Pip target range. An FXCM Demo Account was opened on October 1, 2014 to track these trades and is now up 17% after 5 trades. This account would also only require 8 trades for the 100% target.


RATE OF RETURN - DEMO ACCOUNT


DEMO TRADES MADE


ACCOUNT BALANCE


When these results are compared with the Year-To-Date returns as at September 30, 2014 of the Top 10 Currency Traders as ranked by BarclayHedge...


SEPTEMBER YEAR-TO-DATE RETURNS OF CURRENCY TRADERS 


....the Methodology so far, appears to be able to hold its own.

Naturally, for reasons of privacy, I only share the results of individual trades on my Live Account without showing my actual Trading Account. However, since this Demo Account is only behind by 3 trades and is audited by the trade verification services of MyfxBook, you can be assured of the integrity of the information you see here.


RATE OF RETURN- DEMO ACCOUNT

(http://www.myfxbook.com/members/DRFXTRADING/duane/1079693)


The style of trading that has produced these results is both conservative and high-paying. Trading is only done 1 to 2 times per month, minimizing the exposure of your capital to the volatility of the market. When trading is conducted, however, only the highest paying Swing Trading opportunities that have the largest probability of success are targeted.


______________________________________________


RECENT EMAIL FROM CLIENT


Sabtu, 07 Mei 2016

NZD CAD SHARP 800 PIP FALSE BREAKOUT AS FORECAST - mtf forex trading system

NZD CAD SHARP 800 PIP FALSE BREAKOUT AS FORECAST ~ mtf forex trading system


The last time we examined this pair in April this year, we had projected a sharp decline in favour of the Canadian Dollar based on the False Breakout pattern that had been unfolding. In the chart below, we can see that the Bullish Candles that attempted to break out long from the Pennant were eventually taken out by the slow Bearish Candles that took us back inside of the Consolidation.


DAILY CHART - FALSE BREAKOUT 


Based on this movement and the fact that False Breakouts usually lead to breaks at the opposing end of the Pennant, we had projected the pair to break towards the major Outer Uptrend Line.


DAILY CHART - PROJECTED DECLINE 


Looking at the current situation on the Daily Chart, we can see that this forecast had in fact materialized over the last few weeks. Starting from the high of the start of the reversal, the pair has declined sharply by approximately 800 Pips.


DAILY CHART - SHARP DECLINE 


Now, how could you have taken advantage of this profitable move?

Having seen the start of the breakout below the Support of the Pennant, the first thing to do would have been to draw the Downtrend Lines that were being formed.


DAILY CHART - DOWNTREND LINES 


These Downtrend Lines can be used for the placement of Stop Losses with the assurance that your profits will be protected throughout the trade. The next step would have been to enter short at around the 0,9100 area, with a Stop Loss of 100 Pips placed above the Inner Downtrend Line. Your Limit Order would initially be set to the Outer Uptrend Line for a profit of 370 Pips.


DAILY CHART - ENTRY SETUP


As the market began to move in you favour, you would have moved your Stop Loss lower, breaking even initially and then locking in profits below your Entry. This would have continued until the market started to reverse bullish just above the Outer Uptrend Line target. Your Stop Loss would “sadly” have been taken out and you would have pocketed 300 Pips in gains.


DAILY CHART - 300 PIP PROFIT


This is one of the ways in which Breakouts and False Breakouts can be profitably traded in this market. Many of these opportunities are likely to continue to present themselves for us given the current environment of low liquidity that now characterizes the major Currency Pairs. As Swing Traders, we simply need to spot these setups and the appropriate signals provided to take advantage of them, for continued monetary reward.


_______________________________________________


More info for NZD CAD SHARP 800 PIP FALSE BREAKOUT AS FORECAST ~ mtf forex trading system:
 

Income from Forex Robot Copyright © 2016 -- Powered by Blogger