NZD CAD SHARP 800 PIP FALSE BREAKOUT AS FORECAST ~ mtf forex trading system
The last time we examined this pair in April this year, we had projected a sharp decline in favour of the Canadian Dollar based on the False Breakout pattern that had been unfolding. In the chart below, we can see that the Bullish Candles that attempted to break out long from the Pennant were eventually taken out by the slow Bearish Candles that took us back inside of the Consolidation.
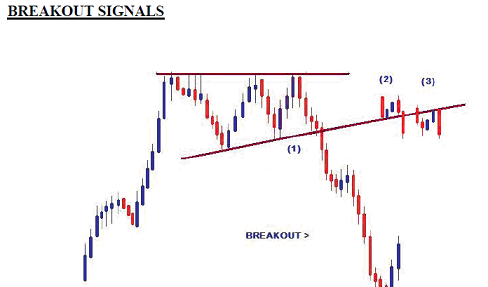
DAILY CHART - FALSE BREAKOUT

Based on this movement and the fact that False Breakouts usually lead to breaks at the opposing end of the Pennant, we had projected the pair to break towards the major Outer Uptrend Line.
DAILY CHART - PROJECTED DECLINE

Looking at the current situation on the Daily Chart, we can see that this forecast had in fact materialized over the last few weeks. Starting from the high of the start of the reversal, the pair has declined sharply by approximately 800 Pips.
DAILY CHART - SHARP DECLINE

Now, how could you have taken advantage of this profitable move?
Having seen the start of the breakout below the Support of the Pennant, the first thing to do would have been to draw the Downtrend Lines that were being formed.
DAILY CHART - DOWNTREND LINES

These Downtrend Lines can be used for the placement of Stop Losses with the assurance that your profits will be protected throughout the trade. The next step would have been to enter short at around the 0,9100 area, with a Stop Loss of 100 Pips placed above the Inner Downtrend Line. Your Limit Order would initially be set to the Outer Uptrend Line for a profit of 370 Pips.
DAILY CHART - ENTRY SETUP

As the market began to move in you favour, you would have moved your Stop Loss lower, breaking even initially and then locking in profits below your Entry. This would have continued until the market started to reverse bullish just above the Outer Uptrend Line target. Your Stop Loss would “sadly” have been taken out and you would have pocketed 300 Pips in gains.
DAILY CHART - 300 PIP PROFIT

This is one of the ways in which Breakouts and False Breakouts can be profitably traded in this market. Many of these opportunities are likely to continue to present themselves for us given the current environment of low liquidity that now characterizes the major Currency Pairs. As Swing Traders, we simply need to spot these setups and the appropriate signals provided to take advantage of them, for continued monetary reward.

_______________________________________________
More info for NZD CAD SHARP 800 PIP FALSE BREAKOUT AS FORECAST ~ mtf forex trading system: