NZD JPY BEAR CROWN SETUP MAJOR YEN GAINS AHEAD ~ morning forex trading system
After a strong Uptrend that started in 2013 and which has been defined by an Inner and an Outer Uptrend Line, a large Bear Crown/Head & Shoulders pattern has now appeared to signal the start of a new Downtrend in favour of the Yen. This pattern, along with Double Bottoms, Double Tops and Consolidation Breakouts are the typical setups seen ahead of a major change in market direction. Given the size of this Bear Crown setup and the fact that this has been formed on the Daily Chart, there is a large probability that the Japanese Yen will appreciate significantly against the Kiwi over the next few months and years to come.
Taking a look at the broader picture, we can see the direction of this pair over the last 6 years.
DAILY CHART - LARGE UPTREND 2009-2015

A closer look at this pair reveals a large Bear Crown/Head and Shoulders Pattern that has now been formed at the Inner Uptrend Line.
DAILY CHART - BEAR CROWN SETUP

This type of setup is normally associated with trend changes on all time frames, but when they are seen on the larger charts such as the Daily or Weekly, they usually indicate that a major trend change is about to take place.
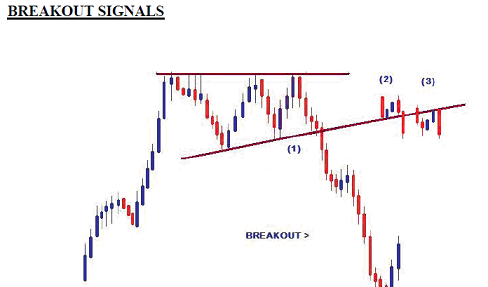
CROWN/HEAD & SHOULDERS SETUPS

There is normally a setup on the left-hand-side of the chart such as a Counter Trend Line or a Consolidation that forms the Left Tip/Shoulder. This is then broken in the direction of the trend before the market U-Turns to form the Centre Tip/Head, pulling back towards and often breaking existing Trend Lines. Following this, the market then continues moving sideways to form the Right Tip/Shoulder taking the shape of another Counter Trend Line or Consolidation. This setup will then be broken as the pair begins to form a new trend.
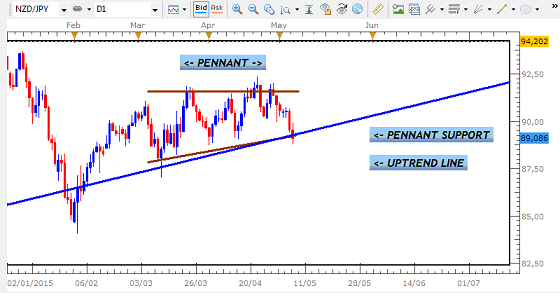
Taking a closer look, we can see that the Pennant that represents the Right Tip of the Crown lies on top of the major Inner Uptrend Line. This means that any break out short would break both the Support and the Uptrend Lines to provide us with two strong signals that indicate the start of a new Downtrend.
DAILY CHART - RIGHT TIP SETUP
DAILY CHART - POSSIBLE BREAKOUT

If this Breakout Candle is a Normal Candle and is supported by a strong setup on the 4 Hour Chart that conforms to the criteria of this Trade Sheet, we could capture a comfortable profit of 200 Pips from the breakout.
TRADE SHEET SETUP

Given that this would be a Consolidation Breakout, the movement is expected to be very fast, taking only 3 - 12 days to hit this and other short-term targets.
With Consolidation Setups such as these, there is generally a 50-50 chance of a breakout in either direction when these setups are examined in isolation. However, within the context of this large Bear Crown Setup that has taken a year to be formed, a sustained breakout bearish for strong Japanese Yen gains is the more likely outcome.
_____________________________________________

More info for NZD JPY BEAR CROWN SETUP MAJOR YEN GAINS AHEAD ~ morning forex trading system: