Tampilkan postingan dengan label above. Tampilkan semua postingan

Sabtu, 07 Mei 2016

NZD CAD SHARP 800 PIP FALSE BREAKOUT AS FORECAST - mtf forex trading system

NZD CAD SHARP 800 PIP FALSE BREAKOUT AS FORECAST ~ mtf forex trading system


The last time we examined this pair in April this year, we had projected a sharp decline in favour of the Canadian Dollar based on the False Breakout pattern that had been unfolding. In the chart below, we can see that the Bullish Candles that attempted to break out long from the Pennant were eventually taken out by the slow Bearish Candles that took us back inside of the Consolidation.


DAILY CHART - FALSE BREAKOUT 


Based on this movement and the fact that False Breakouts usually lead to breaks at the opposing end of the Pennant, we had projected the pair to break towards the major Outer Uptrend Line.


DAILY CHART - PROJECTED DECLINE 


Looking at the current situation on the Daily Chart, we can see that this forecast had in fact materialized over the last few weeks. Starting from the high of the start of the reversal, the pair has declined sharply by approximately 800 Pips.


DAILY CHART - SHARP DECLINE 


Now, how could you have taken advantage of this profitable move?

Having seen the start of the breakout below the Support of the Pennant, the first thing to do would have been to draw the Downtrend Lines that were being formed.


DAILY CHART - DOWNTREND LINES 


These Downtrend Lines can be used for the placement of Stop Losses with the assurance that your profits will be protected throughout the trade. The next step would have been to enter short at around the 0,9100 area, with a Stop Loss of 100 Pips placed above the Inner Downtrend Line. Your Limit Order would initially be set to the Outer Uptrend Line for a profit of 370 Pips.


DAILY CHART - ENTRY SETUP


As the market began to move in you favour, you would have moved your Stop Loss lower, breaking even initially and then locking in profits below your Entry. This would have continued until the market started to reverse bullish just above the Outer Uptrend Line target. Your Stop Loss would “sadly” have been taken out and you would have pocketed 300 Pips in gains.


DAILY CHART - 300 PIP PROFIT


This is one of the ways in which Breakouts and False Breakouts can be profitably traded in this market. Many of these opportunities are likely to continue to present themselves for us given the current environment of low liquidity that now characterizes the major Currency Pairs. As Swing Traders, we simply need to spot these setups and the appropriate signals provided to take advantage of them, for continued monetary reward.


_______________________________________________


More info for NZD CAD SHARP 800 PIP FALSE BREAKOUT AS FORECAST ~ mtf forex trading system:

Minggu, 24 April 2016

AUD NZD BULLISH BREAKOUT SIGNAL ABOVE MAJOR CONSOLIDATION - the ultimate forex trading system pdf

AUD NZD BULLISH BREAKOUT SIGNAL ABOVE MAJOR CONSOLIDATION ~ the ultimate forex trading system pdf


This pair has given us a Bullish breakout candle to signal the possible start of a sharp breakout in favour of the Aussie Dollar. A Range setup that lies above the Resistance of the larger Pennant was broken today with a strong Bull Candle. Breakouts from large Consolidations often have smaller setups at their boundaries which provide the signal needed to start the breakout. If this breakout materializes, then we could see the first major target at 1,1298 being hit by the end of this month.

The chart below shows that this pair began forming the large Pennant after breaking above the major Inner Trend Line of a previous Downtrend.


DAILY CHART


Large sideways patterns and breaks of Inner Trend Lines often appear at the end of a very long trend and the start of new one. The chart below shows us a closer view of this Pennant that could represent the setup that starts this new trend and takes us up to the Outer Downtrend Line.


DAILY CHART


You can see the Range setup above the Resistance of the Pennant. Smaller Consolidation patterns are often formed ahead of a breakout from an even larger Consolidation. Assuming that the signal given above this Range will lead to a new Uptrend, the first target to be hit would be the Breakout Equivalent (B.E.) of the Range. This is the target to which all Consolidation patterns break towards before coming to an end. 


DAILY CHART


When this first target is hit, the market is likely to pause for a short period before moving on to hit higher targets. Traders have the option of either exiting for a profit at this area and re-entering when the trend resumes or holding on for even larger gains. This decision will often come down to the trading objectives of the individual Retail/Institutional Trader. 

As straightforward as this setup appears to be, trading Consolidation Breakouts can be very difficult. The Pip targets are much larger and can present a challenge as to how many we should aim for and the time period over which we should hold our positions. We are also confronted with the dilemma of whether to monitor the positions or leave them until the target is hit. All of these issues and more are broken down and solved in the Trading Manual below. Targets, Stop Losses, Limits as well as the Holding Period for these types of trades are all based on clear and proven trading rules that you can use for this and upcoming trading opportunities.


___________________________________________________________


RECENT EMAIL FROM CLIENT


____________________________________________________


SUBSCRIBE TODAY

____________________________________________________


Buy Now
US$120.00


Support independent publishing: Buy this e-book on Lulu.

Free 
 ___________________________________________


Duane Shepherd 
(M.Sc. Economics, B.Sc. Management and Economics)
Currency Analyst/Trader
Contact: shepherdduane@gmail.com
Twitter: @WorldWide876
Facebook: DRFXTRADING 

More info for AUD NZD BULLISH BREAKOUT SIGNAL ABOVE MAJOR CONSOLIDATION ~ the ultimate forex trading system pdf:

Jumat, 01 April 2016

GBP JPY STRONG BREAKOUT STARTED ABOVE LARGE CONSOLIDATION - my forex trading system

GBP JPY STRONG BREAKOUT STARTED ABOVE LARGE CONSOLIDATION ~ my forex trading system


This pair has been in a very strong Uptrend that began in 2012, forming an Inner and Outer Uptrend Line and 2 Large Pennant Consolidations. 


DAILY CHART - STRONG UPTREND


We can now see that it has started to breakout from this 2nd Pennant with strong Bullish Candles above Resistance.


DAILY CHART - PENNANT BREAKOUT


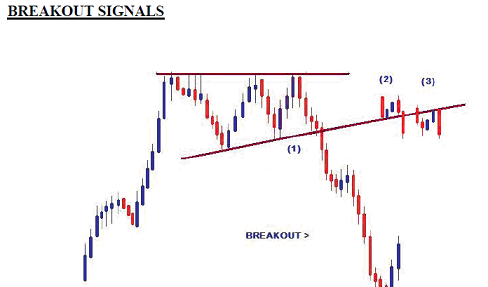
The manner in which this started is one of 3 ways in which these Consolidation setups tend to be broken in this market.


1) The First is when the market simply provides a Single Breakout Candle without any pullbacks;

2) The Second way is when the market pulls back on the inside of the barrier and then U-Turns to provide the breakout signal;

3) The Third way- which is what has taken place here - is when the market initially breaks the barrier, U-Turns to test the barrier before U-Turning to give the signal that leads to the breakout;


These alternate forms can be seen in the diagram below taken from the Trading Manual;


DAILY CHART - BREAKOUT SIGNAL


As attractive as this signal has been on the Daily Chart, the size of the Stop Losses required to trade this breakout on the 4 Hour Chart have been too large.

Based on where we would have entered at the close of the Daily Candle, the Stop Loss would have been 332 Pips for the 1st entry option. With the 2nd Bullish Signal, the Stop would have been 169 Pips- both of which are too large for the average Retail Trader.


4 HOUR CHART - ENTRY SIGNALS


So the overall setup and breakout signal on the Daily Chart were strong, but unfortunately can’t be traded based on the Stop Losses required.

In these situations, we simply either wait on another setup on this pair that offers a smaller Stop Loss, or move on to another pair.


VIDEO ANALYSIS OF GBP JPY, MAY 13, 2015


_____________________________________________________________________


More info for GBP JPY STRONG BREAKOUT STARTED ABOVE LARGE CONSOLIDATION ~ my forex trading system:

Sabtu, 19 Maret 2016

GBP JPY LOOKING TO CONTINUE NEW DOWNTTREND - forex day trading system - peak and valley method

GBP JPY LOOKING TO CONTINUE NEW DOWNTTREND ~ forex day trading system - peak and valley method


With most of the major Currency Pairs already starting new trends, the GBP JPY also looks to be starting one of its own after breaking its major Inner Uprtrend Line. Having done this, the pair has hit its 500 - Pip Weekly Range and has been moving sideways as is customary at this area. If this movement eventually takes the form of a Range pattern and leads to a bearish breakout, then further gains are expected for the Japanese Yen.

We can see the broken Inner Uptrend Line in the chart below that has started a new Downtrend. If this new direction continues, then the Outer Uptrend Lines would be the next major targets.


DAILY CHART


The sideways movement now taking place could lead to the formation of a Range setup if the 2nd Resistance point is formed (r2). A break of Support with a strong Bearish Candle would then be needed to confirm the continuation of this Downtrend.


DAILY CHART

  
Looking ahead, the next price target to be hit would be the 2nd Weekly Range. This would lie around the 167.00 area and could be reached within 10 days from this breakout.


___________________________________________________________


RECENT EMAIL FROM CLIENT


____________________________________________________


SUBSCRIBE TODAY

____________________________________________________


Buy Now
US$120.00


Support independent publishing: Buy this e-book on Lulu.

Free 
 ___________________________________________


Duane Shepherd 
(M.Sc. Economics, B.Sc. Management and Economics)
Currency Analyst/Trader
Contact: shepherdduane@gmail.com
Twitter: @WorldWide876
Facebook: DRFXTRADING 

More info for GBP JPY LOOKING TO CONTINUE NEW DOWNTTREND ~ forex day trading system - peak and valley method:
 

Income from Forex Robot Copyright © 2016 -- Powered by Blogger