Tampilkan postingan dengan label ahead. Tampilkan semua postingan

Minggu, 22 Mei 2016

EURO USD TRADING GAIN AHEAD OF STRONG REVERSAL - forex lines 7 trading system review

EURO USD TRADING GAIN AHEAD OF STRONG REVERSAL ~ forex lines 7 trading system review


The EURO USD provided us with a small trading gain of 46 Pips on Thursday as we took advantage of the sharp Bullish Reversal that was predicted in December 2015. The original trading target was 165 Pips but by the end of the Holding Period established for this trade this had not been hit, obligating us to close our trade for the smaller profit. During this trade, a sharp bearish pullback had threatened our Stop Loss, coming within 5 Pips of taking out our trade. 

This pullback would have tempted many to exit the trade for fear of being stopped out. However, thanks to the rule that we have of never looking at our trades while they are open, we were able to capture this trading gain as the market u-turned and rallied once more. As a result, this trade, combined with the 138 Pips from the GBP USD, has now given us a good start to 2016 with a Rate of Return of 9.4%.


The screenshot below is taken from the Private Video Analysis we did for the EURO USD in December which predicted the sharp rally. 


As can be seen from the current patterns for this pair, this was exactly what occurred in the last few days. This provided us with the trading gain as we entered at one of the Bullish Candlestick Signals.


The chart below shows our Entry Setup on the 4 Hour Chart, including the original target that was set at the Resistance Boundary of the Range.


Entry and our Stop Loss placement were done using this ABC setup - a setup that was predicted a few days earlier...


Now this is where it got interesting. For traders who choose to follow their trades, the pullback that took place after entry would have led many to close the trade as the market began reversing towards the Stop Loss.


This would have led to an unnecessary loss instead of the trading gains offered by the rally that eventually took place. The temptation to monitor our trades while they are in motion is very common. It is very natural to want to ensure that our trades are heading towards our targets without any pullbacks that threaten our Stops. While this can prevent some losses, it is a habit that can affect our long-term profitability. 


The Forex, like all markets, has a natural tendency to move in waves towards its daily, weekly, monthly and yearly targets. This reflects the changing value of currency pairs in response to changes in economic fundamentals and investor sentiment. It is therefore necessary for us to expect this for all our trades and not interfere. This is why it is crucial to adjust your platform so that you do not see the chart of the trade open nor the balance but only the tab that shows you whether the trade is still open.


Another important issue related to this trade was the Holding Period. Keeping our trades open for too short a period can curtail our profitability while having them open for too long can expose us open to unnecessary volatility. It is for this reason why a specific time period is used for each type of trade to establish a balance between these two extremes. 

When the Holding Period for this trade had ended, we had to close the trade regardless of the floating profit/loss at the time. This decision was later proven to be accurate as you can see from the pullback now taking place.


This trade highlighted many of the important things we need to succeed at trading over the long-term. These relate to the technical factors that determine our decision to execute a trade but more importantly the emotional aspects of trading - the traders Achilles Heel. 

Watching our trades can feel like the right thing to do to ensure profitability given the volatility of this market. However, this can be a serious hindrance to success if this leads to the habit of constantly closing trades before they have a chance to hit our targets. By adhering to the rule of not watching your trades and obeying the Holding Period, you will be assured of maximum gains for each trade ahead of sharp market reversals.


___________________________________

More info for EURO USD TRADING GAIN AHEAD OF STRONG REVERSAL ~ forex lines 7 trading system review:

Sabtu, 21 Mei 2016

RBNZ Cuts EURO NZD Drops PIPS Lie Ahead - simple forex trading system that works

RBNZ Cuts EURO NZD Drops PIPS Lie Ahead ~ simple forex trading system that works


After moving within a 400-Pip Range since the end of March this year, the EURO NZD has finally broken this boundary with a break of Support following the increase in interest rates by the Reserve Bank of New Zealand (RBNZ). The pair fell by more than 200 Pips within 24 hours of the decision to form a strong bearish candle below the Range, indicating the start of even stronger gains for the Kiwi in weeks to come.


THE RATE CUT

The RBNZ took the decision to raise the official cash rate to 3.25% from 3.00% as it seeks to stave off inflationary pressures that have begun to threaten the economy. In justifying the move, RBNZ Governor Graeme Wheeler stated that it was important that inflation expectations remain contained and that interest rates return to a more neutral level. Naturally, in an environment of homogeneous interest rate policy among the major central banks, the increase led to strong demand for the Kiwi against several of its counterparts including the US Dollar, the Aussie Dollar and the Great British Pound. Continued strengthening is expected for the Kiwi against these currencies, but the setup against the Euro appears to be very promising right now for aggressive Swing/Weekly Range traders.


RANGE BREAKOUT

Looking at the chart below, we can see the bear candle that closed below the Support level following the rate decision. This is the type of signal that traders look for to open a position for a strong breakout, especially when it is sync with the existing direction of the trend.


DAILY CHART- EURO NZD BREAKOUT


Most traders would probably starting entering short at this point, with the Stop Loss placed above the Support which would now act as Resistance to protect the trade. Entering early often gives traders a good opening price in case the market moves quickly in the expected direction. However, there is always the possibility of an unexpected reversal known as a False Breakout whenever we have a breakout signal from Consolidation. 

Given this possibility and the fact that the last candle led to the Weekly Range of the pair being reached (see Trade Manual), it would be better to wait until another bearish signal appears after a brief pause or rally that tests the Support.


DAILY CHART - EURO NZD - POTENTIAL PULLBACK TEST


This pause/test can either take the form of a rally followed by a strong U-Turn or a move sideways to form a small consolidation before breaking short. If either scenario unfolds, the ultimate target for this new downtrend would be 1,4855 -the Breakout Equivalent of the Consolidation (see Trade Manual). Along the way, several areas of past Support will be hit, allowing for short-term profit-taking as well.


Lets be patient, see what unfolds and take advantage of profitable setups when they appear.


RECENT EMAIL FROM CLIENT


____________________________________________________


SUBSCRIBE TODAY

____________________________________________________


Buy Now
US$120.00


Support independent publishing: Buy this e-book on Lulu.

Free 
 ___________________________________________


Duane Shepherd 
(M.Sc. Economics, B.Sc. Management and Economics)
Currency Analyst/Trader
Contact: shepherdduane@gmail.com
Twitter: @WorldWide876
Facebook: DRFXTRADING 

More info for RBNZ Cuts EURO NZD Drops PIPS Lie Ahead ~ simple forex trading system that works:

Minggu, 08 Mei 2016

ACCURATE EXIT STRATEGIES PROVIDE GAINS AHEAD OF SHARP REVERSALS - martingale forex trading system

ACCURATE EXIT STRATEGIES PROVIDE GAINS AHEAD OF SHARP REVERSALS ~ martingale forex trading system


Last month, the EURO JPY and CHF JPY pairs broke their respective Consolidation Setups on their Daily Charts to start downtrends in favour of the Japanese Yen. This was expected to provide several hundreds of Pips in gains for traders over several weeks given the size of the Consolidations that were broken. However, although the CHF JPY did move by over 200 Pips (providing us with a 101-Pip gain), the EURO JPY only provided us with just under 50 Pips in profits before pulling back. 

Nevertheless, despite the combined profitability of these trades being lower than expected, the sharp 400-Pip reversals that took place highlighted the accuracy of the Holding Periods used for these Swing Trading Strategies.


EURO JPY TRADE


A target of 172 Pips was initially set to be captured from the Pennant breakout below its Support boundary. However, due partly to the lack of market activity during the Thanksgiving holiday period, the trade was only up by 47 Pips at the end of the Holding Period - smaller than expected but a win nevertheless.


DAILY CHART
(FXCM Charts used for Entry Signals as they use the New York Close of the Daily Candle - crucial for the Price Action Methodology)


DAILY CHART
(Actual Trades done using the Dukascopy Platform)


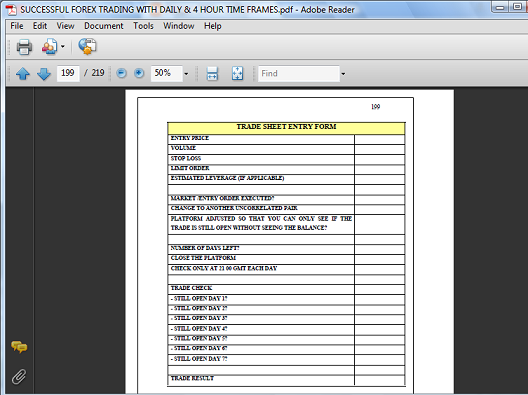
The decision to exit this trade was controlled by the Holding Period Rule for this breakout strategy. As you can see from the Trade Sheet, a maximum of 7 Days is used for these trades and once this limit has been reached, the trade is closed - regardless of the floating profit or what we would have wanted from the trade.


TRADE SHEET
(Trading Manual - "Successful Forex Trading With the Daily and 4 Hour Time Frames".
Available at www.drfxswingtrading.com)


CHF JPY TRADE


This was a similar trade that took place during the same period as the EURO JPY breakout. A Pennant Setup was also being broken at Support following a pullback that tested then U-Turned at this boundary. The nature of the candles that started the breakout indicated that we would be using the Swing Trading Strategy for Slow Breakouts.


DAILY CHART


Having determined that the setup and signals conformed to the criteria for this strategy, the trade was executed with an initial target of 180 Pips. However, at the end of the Holding Period for this strategy, the trade was up by 101 Pips - again, smaller than planned but a good trading gain nevertheless.


DAILY CHART


SHARP REVERSALS

The decisions to close these trades at the end of their respective Holding Periods were proven to be spot on given the reversals that took place a few days later. These reversals reflected the market reaction to the decisions made by the European Central Bank on Thursday December 4, 2015.


EURO JPY


CHF JPY


The reversals on both now indicate that we are starting the patterns of False Breakouts that will take us quickly back inside of these Consolidations. Following this, it is likely that they will breakout at Resistance to start strong Uptrends in favour of the EURO and the CHF. 

These sharp movements reinforced the need for Swing Traders to always implement and obey the time limits set for our trades. Reversals of 10, 20 or even 40 Pips are usually the consequences of disobeying these rules, but pullbacks of 400 Pips have a way of sobering us up to the harsh reality of what this market can do to us when we trade based on emotions, greed and our ego. It is often very tempting to want more out of a trade especially after a loss or when the market has only given us a fraction of what we want out of a trade. However, it always better to have smaller gains than large losses. 


More info for ACCURATE EXIT STRATEGIES PROVIDE GAINS AHEAD OF SHARP REVERSALS ~ martingale forex trading system:

Senin, 02 Mei 2016

USD CAD AT MAJOR TREND LINE STRONG RALLY AHEAD - forex trading system scams

USD CAD AT MAJOR TREND LINE STRONG RALLY AHEAD ~ forex trading system scams


The USD CAD is now just above a major Uptrend Line following a recent downtrend that led to strong gains for the Loonie. With this Uptrend Line having defined the direction of the pair since 2012, we could either see a strong rally above the current Downtrend Line or a major break to resume the downtrend.


This Uptrend Line supported a very strong rally that carried the currency pair from 0,9632 in September 2012 to the high of 1,1277 in March 2014. We can also see that there were four previous rallies at this Trend Line, indicating the strength of this boundary.


DAILY CHART


Looking at the recent downtrend that has carried us to this Trend Line once more, we can see that it provided a trading opportunity when a Range setup was broken. Entry at the breakout candle could have given the trader a little over 100 Pips with the exit taking place above the Uptrend Line.


DAILY CHART


From this point, the currency pair can either rally to break the Downtrend Line or break below the Uptrend Line. If it does rally, it can do so with a direct break of the Downtrend Line followed by a test and then a further break long. Alternately, it could also move sideways in a Consolidation before breaking out. Such a setup could also be the precursor to a breakout short below the Uptrend Line.


DAILY CHART


With the pair already reaching its 2nd Weekly Range, however, further moves bearish could be limited if we dont see a large setup formed in the near future (see Trade Manual). This would give the break of the Downtrend Line a higher probability of taking place, providing a larger range of pip targets to choose from.

As with all scenario analyses, one will have to wait for the best signals to be provided by the market to justify entry. In this very low volatility environment of few opportunities, one will have to be sharp to monitor several currencies at a time to be able to spot these rare, but profitable trades.


RECENT EMAIL FROM CLIENT


____________________________________________________


SUBSCRIBE TODAY

____________________________________________________


Buy Now
US$120.00


Support independent publishing: Buy this e-book on Lulu.

Free 
 ___________________________________________


Duane Shepherd 
(M.Sc. Economics, B.Sc. Management and Economics)
Currency Analyst/Trader
Contact: shepherdduane@gmail.com
Twitter: @WorldWide876
Facebook: DRFXTRADING 

More info for USD CAD AT MAJOR TREND LINE STRONG RALLY AHEAD ~ forex trading system scams:

LAST GASP AUSSIE RALLY AHEAD OF SHARP DECLINE - automated forex trading system reviews

LAST GASP AUSSIE RALLY AHEAD OF SHARP DECLINE ~ automated forex trading system reviews


The Aussie-Dollar pair has definitely been testing the patience of traders over the last few weeks, with an extended period of Consolidation above the most recent Uptrend Line. This period of market indecision could either be a setup to resume the current uptrend, or lead to the break of the Uptrend Line to start a downtrend. With the Monthly Range of this pair having been hit (see Trade Manual) and the possible formation of an even larger Pennant taking place, a bearish reversal looks to be the more likely outcome for the rest of 2014.

Both a Pennant and a Small Range have now been formed as the pair slowly drifts sideways below the Uptrend Line. The rally between 1 and 2 and then between 3 and 4 represented the 2 Weekly Ranges that completed the Monthly Range. As with all currency pairs, strong periods of Consolidation are normally formed ahead of either a resumption of the trend or that start of an opposing one.


DAILY CHART - CONSOLIDATION


One reason to support a bearish bias is the fact that we were in a large downtrend that formed with the breakout from a Pennant in 2013. Previous trends can still continue even when the Trend Line has been broken.


DAILY CHART- BROKEN PENNANT


A 2nd reason to expect the depreciation of the Aussie currency is that there have been 3 successive waves of Uptrends and Downtrends that are usually indicative of a large Consolidation setup being formed. The bearish breakout below this Uptrend Line would be the fourth wave and the one that would create the 2nd Resistance point of the Pennant.


DAILY CHART - NEW PENNANT?


Finally, the break of this Uptrend Line is likely to take place based on one of the peculiar aspects of the currency market. Sometimes when there is about to be a trend change, the market will make a last gasp new high or low that changes the angle of the existing Trend Line. When this happens, the market will then break this line to start the new trend.


DAILY CHART- PREVIOUS TREND LINE


The previous Uptrend Line was formed by connecting the S1 and S2 Support points, but when the new high was formed, the 2nd connecting Support point changed to the one below the Pennant.


DAILY CHART - NEW HIGH & TREND LINE


Several other examples of this can be found across all time frames and with all currency pairs.


DAILY CHART - EURO USD


 4 HOUR CHART- USD CAD


15 MINUTE CHART - NZD CHF


These types of Trend Line changes may be thought of as mere coincidences, but the frequency with which they occur makes this unlikely. Traders can use this knowledge to anticipate a trend change especially if the existing trend has had a very long run followed by a period of Consolidation.

The fact that several of the most popular and liquid currency pairs have also been in Consolidation supports the bearish scenario for the Aussie Dollar. Trends have been few and far between in an environment of low volatility and minimal interest rate differentials. Therefore, identifying and knowing how to trade these setups will allow traders to continue to make money.


RECENT EMAIL FROM CLIENT


____________________________________________________


SUBSCRIBE TODAY

____________________________________________________


Buy Now
US$120.00


Support independent publishing: Buy this e-book on Lulu.

Free 
 ___________________________________________


Duane Shepherd 
(M.Sc. Economics, B.Sc. Management and Economics)
Currency Analyst/Trader
Contact: shepherdduane@gmail.com
Twitter: @WorldWide876
Facebook: DRFXTRADING 

More info for LAST GASP AUSSIE RALLY AHEAD OF SHARP DECLINE ~ automated forex trading system reviews:
 

Income from Forex Robot Copyright © 2016 -- Powered by Blogger